Knowing is not enough; we must apply. Willing is not enough; we must do.
against MUR
USD
EUR/USD
The Euro tumbled to a fresh 3-week low at $1.1032 amid a stronger U.S. dollar ahead of jobs and ISM Services PMI data due later today.
GBP/USD
The Pound Sterling sank to $1.3180 amid escalating geopolitical tensions in the Middle East.
USD/JPY
The Japanese Yen weakened to 146.50 against the greenback as PM Ishiba expressed caution regarding further rate hikes.
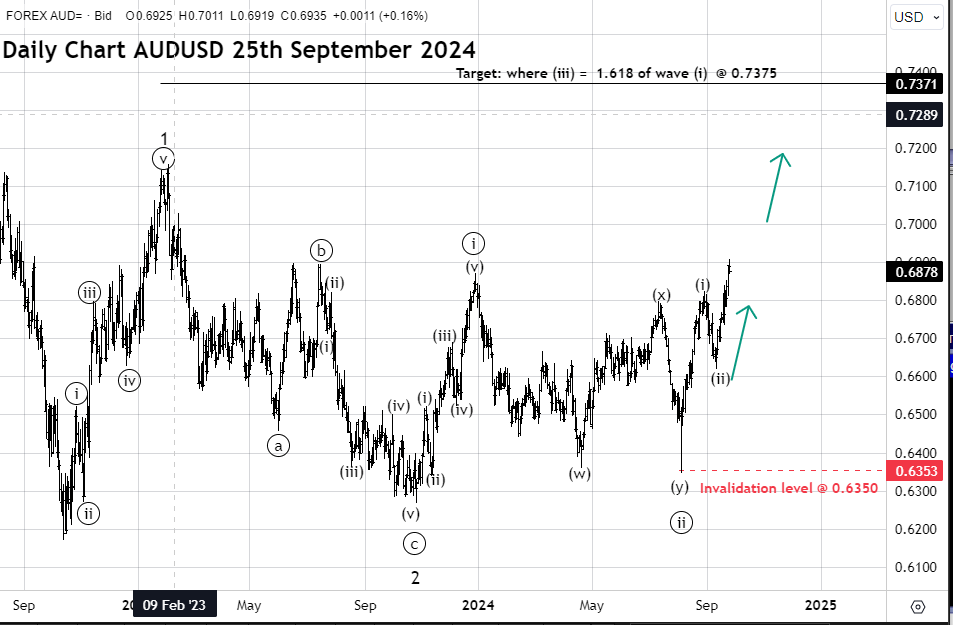
AUD/USD
The Aussie dollar remained subdued at around $0.6870 on mixed Australian Trade Balance data.
USD/CAD
The Canadian dollar closed above 1.3500 against its U.S. counterpart after being pulled to one side by USD strength and to the other by recovering Oil prices.
USD/ZAR
South Africa's rand remained weak against a strong U.S. dollar, trading around 17.37, amid risk aversion due to the Middle East conflict.
USD/MUR
The dollar-rupee gained 15 cents to 46.85 (Selling) this morning.
11:55 EUR German HCOB Composite PMI
11:55 EUR German HCOB Services PMI
12:00 EUR Eurozone HCOB Composite PMI
13:00 EUR Producer Price Index
15:30 USD Challenger Job Cuts
16:30 USD Initial Jobless Claims
17:45 USD S&P Global Composite PMI
18:00 USD Factory Orders
18:00 USD ISM Services PMI

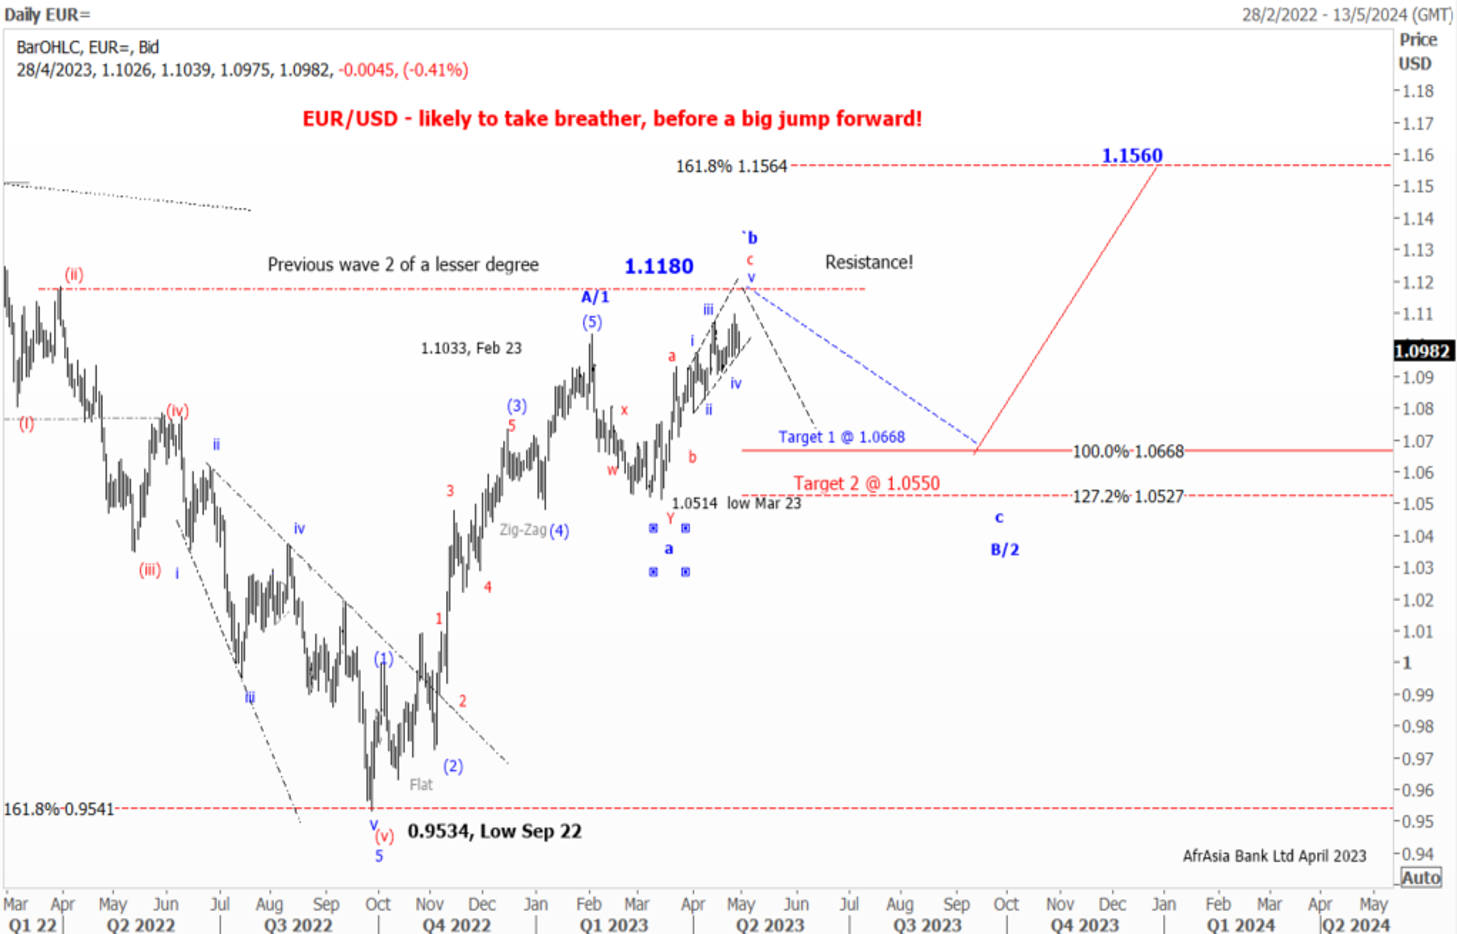
As expected, the EUR/USD has been on a steep uptrend since September 2022 on hawkish ECB.
Elliott wave pattern
Daily Chart
A Clear impulsive 5-wave structure from a low of $0.9534 to a high of $ 1.1035 in February 2023
Possible Expanding Diagonal in wave c of wave b of a flat correction
Forecast
Short term
We expect a corrective setback in wave C in the coming month
1st target 1.1.0670 Wave a =Wave C of a flat correction
2nd Target 1.0530- Wave a =127.2% of wave C of a flat correction
Long term
Once the pullback is completed, we might see the EUR/USD jumping out of the block to $1.1560, followed by $1.2000 by year-end of 2023
News
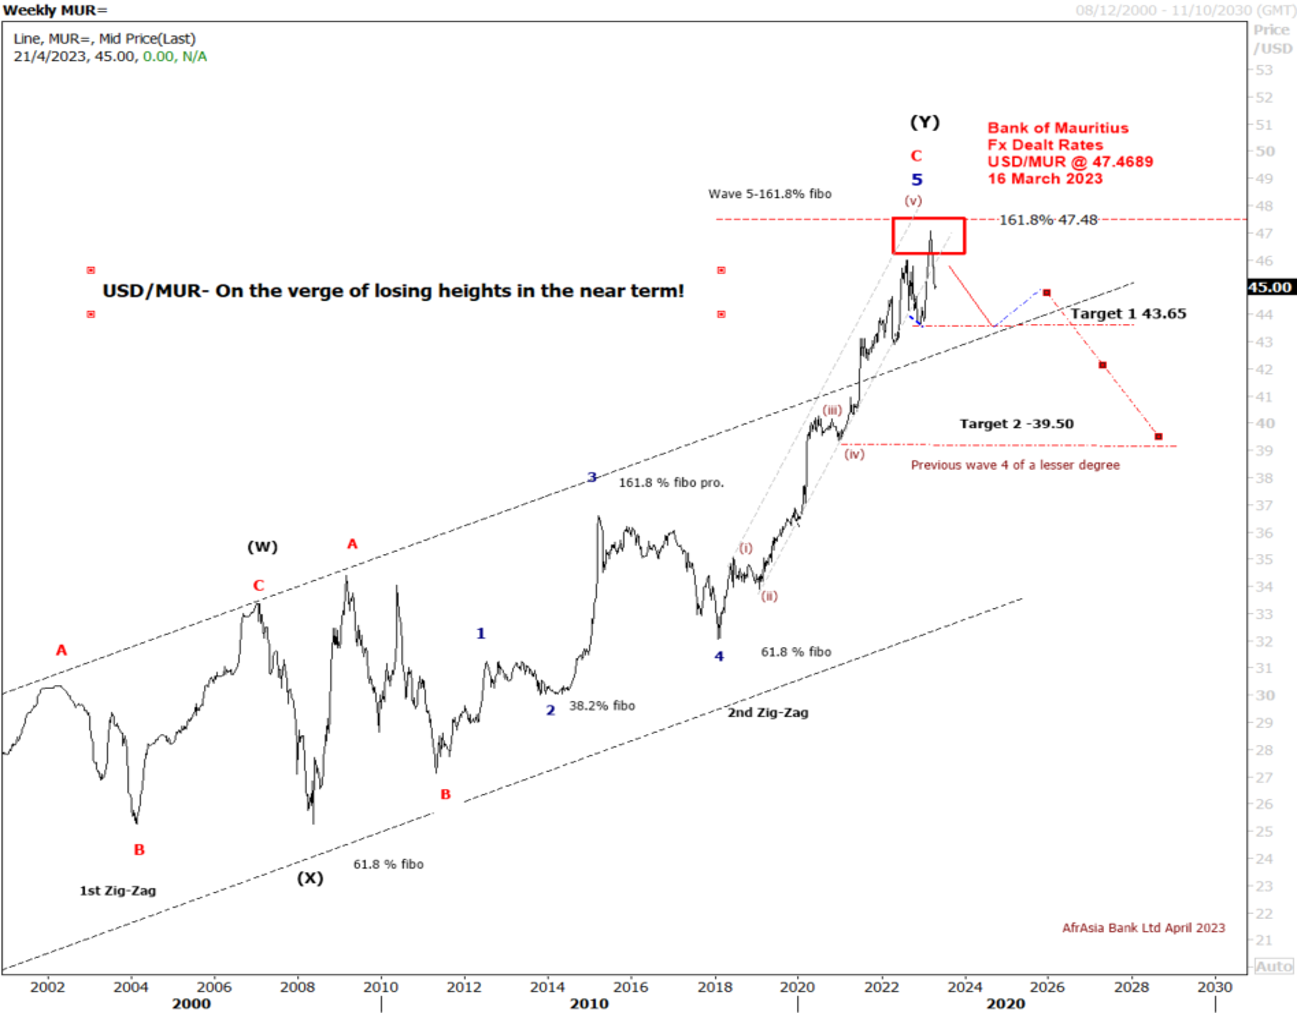
The USD/MUR suddenly burst to a new high at 47.48 in March, driven by FX liquidity concerns, before BOM stepped in to smooth the excessive volatility and injected USD 30 mio on the domestic market.
The USD/MUR fell sharply to 45.40 in the wake of three interventions of the Bank of Mauritius from March 2023 to date.
Elliott wave pattern- Weekly Chart
Double zig-zag upward correction in wave W-X-Y, since 2000 completed!
Bearish turn ahead!
Clear 5-wave structure in wave 5 of wave C of wave (Y)
Over the last four years, the USD/MUR surged by 42% from a low of 32.90 in wave 4 to reach an all-time high of 47.47 on 16th of March 2023, before falling back to 45.40 in an impulsive decline from Mid-March to late April 2023
Forecast- USD/MUR on the brink of a downturn in Q2-Q4 of 2023
On the weekly USD/MUR chart, It seems that the pair may have completed a five-wave upward rally in sub-wave (v) of Wave 5 of Wave C of Wave Y with a peak of 47.47 on the 16th of March
Our Short term target is for a downward trend towards 44.00 followed by 43.00 in December 2023
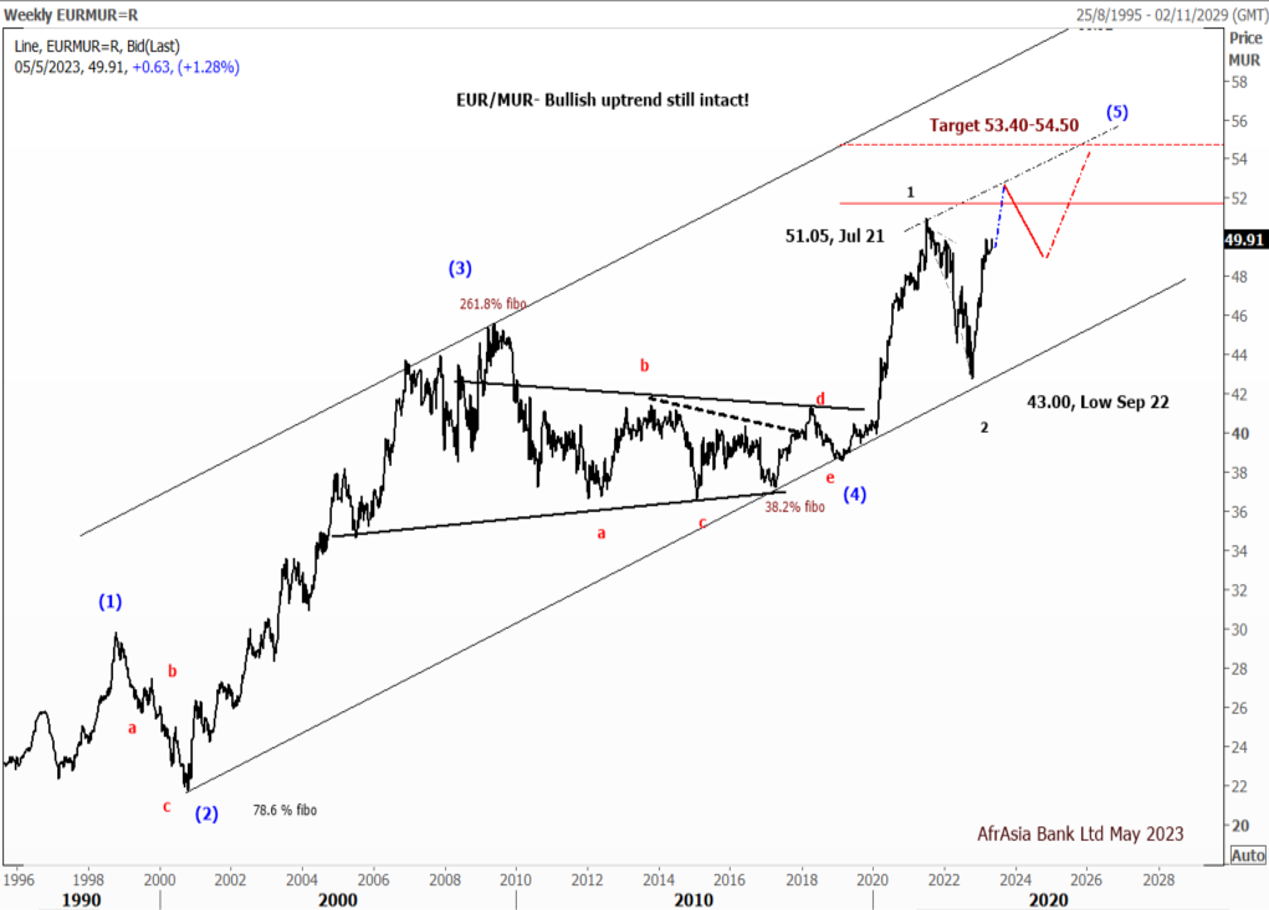
Forecast
EUR/MUR- On the weekly chart, the EUR/MUR may extend its rally in the short term above the high of 51.05 printed in July 2021.
From a technical perspective, on a break of the previous high at 51.05, the pair may find resistance at 52.00, followed by 52.50 by June 2023.
However, we expected the pair to pare some of its gains to 48.50 by September 2023 before a resumption of the uptrend to 53.40-54.50 by December 2023
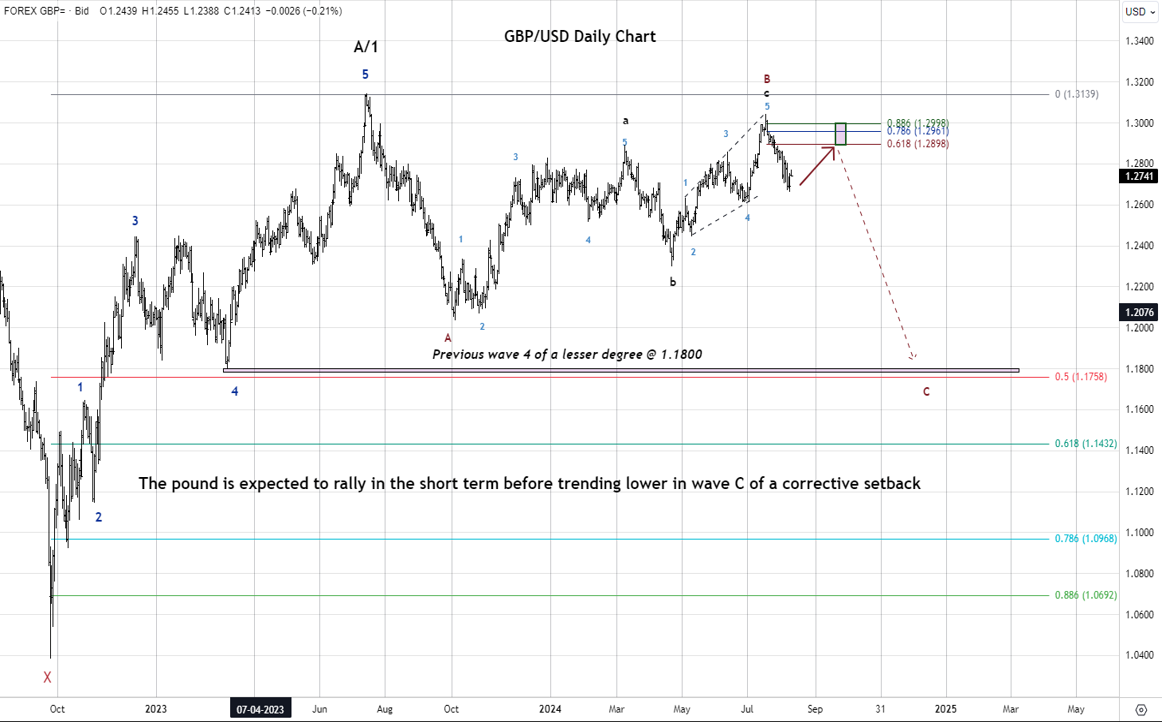
- The British Pound has appreciated by approximately 0.9% this year, positioning it among the top-performing major currencies against the U.S. dollar. Nonetheless, the third quarter of 2024 has proven to be topsy-turvy for the Pound. After reaching a peak of $1.3043 in July following the Labour Party's election victory, it experienced a significant decline in August after the Bank of England's decision to reduce interest rates by a quarter-point to 5%.
Technical Outlook-One leg higher before more sell-off!
Pound in wave C of a corrective Setback.
- From an Elliott Wave perspective, the daily chart reveals that the GBP/USD could still be stuck in a Zig-Zag corrective (A-B-C) setback, with wave C underway.
Forecast
The Pound is expected to experience a short-term rally before trending lower in wave C of a Zig-Zag corrective pattern.
- 1st target 1.2900- 61.8% Fibonacci retracement of the previous decline from 1.3043
- 2nd Target 1.2950/95- 78.6%-88.6% Fibonacci. Retracement.
- 3rd Target 1.1800- Previous wave 4 of a lesser degree
- 4th Target 1.1750- 50% Fibonacci retracement of wave A/1
News
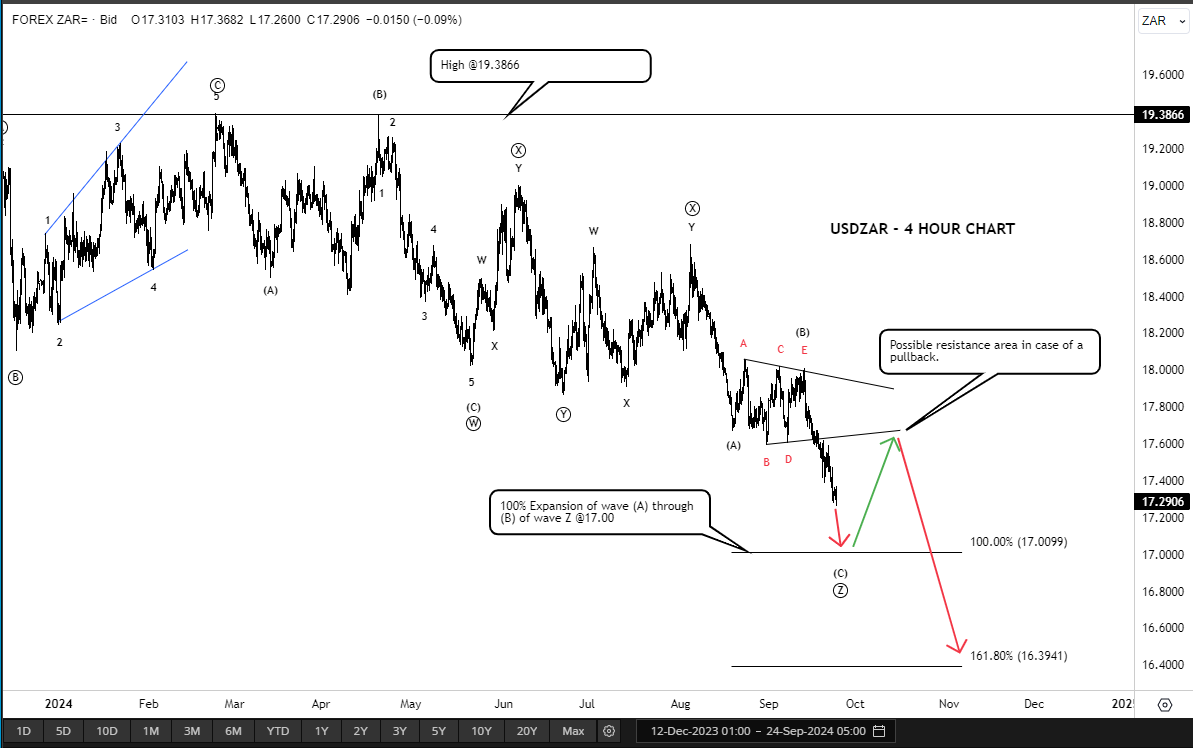
During the third week of September 2024, central banks, including the SARB, and the Fed decided to cut their interest rates. As of today, the interest rates in the U.S. and in South Africa are 4.5%, and 8% respectively.
Technical Outlook
Forecast
We anticipate the USD/ZAR to gradually decrease to 17.0, 16.39 which is the 161.8% expansion of wave (C) for the last zigzag Z.
News
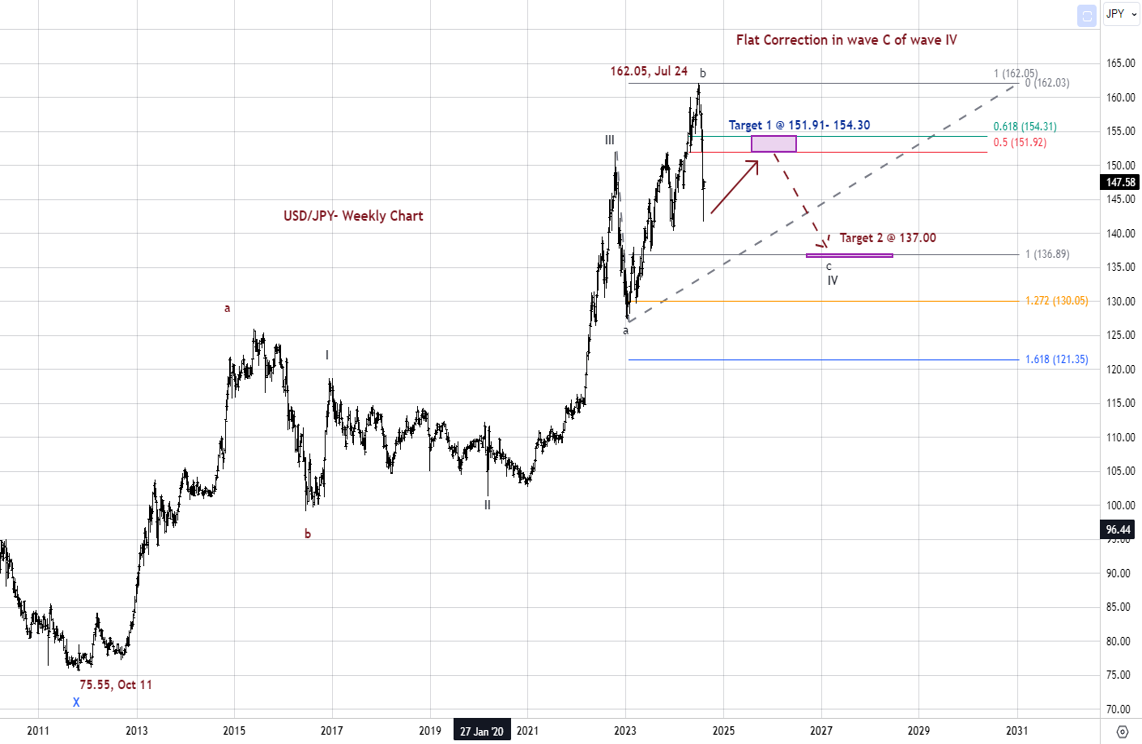
The Japanese currency has strengthened by 9.49% in the current quarter, partially recovering from its earlier losses this year. This was supported by interventions from Japanese authorities, an unexpected interest rate increase by the Bank of Japan to
0.25% from 0 0.1% on July 31, and worries about a slowing U.S. economy.
Technical News
After a significant shift from the 38-year low of 162.05 that hit just at the start of July, the Japanese Yen reversed some of its gains from a seven-month high of 141.675 per dollar last week. This change occurred after an influential BOJ official downplayed the chances of a near-term rate hike in the wake of the BOJ interest rate decision on July 31, which led to bailouts of carry trades on the Yen.
Technical Outlook- Updated
Flat Correction in Wave C of Wave IV
Forecast
On the weekly chart, from an Elliott wave perspective, the USD/JPY is forming a Flat Correction (a-b-c) with wave b finished at 162.05 and wave C still in progress. The pair may continue to rise in the short term before returning to the bearish trend.
1st Target 151.91-154.30 – 50% & 61.8% Fibonacci Retracement from 162.05 to 141.675
2nd Target 137.00 – Wave c= Wave a of the flat correction
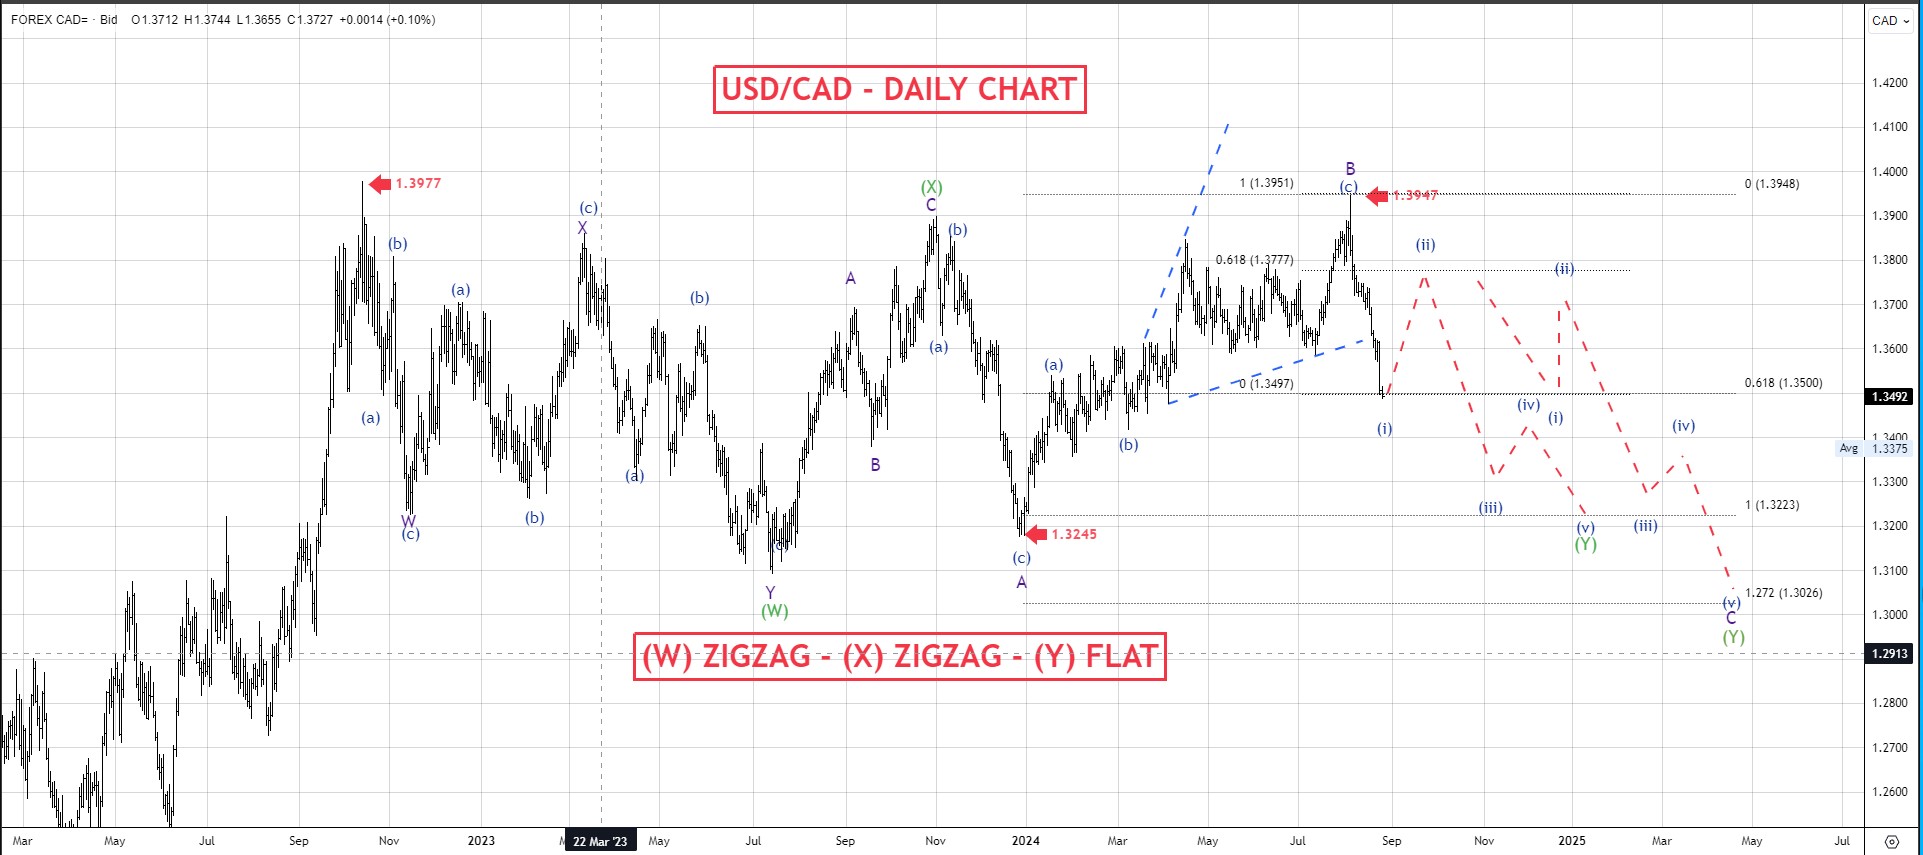
**Technical Analysis**
From an Elliott Wave perspective, the pattern that the USD/CAD pair unveiled since October 2022, starting at 1.3977, may be identified as a combination W-X -Y. Where wave W is a zigzag, wave X is a zigzag, and wave Y is expected be an expanding or running flat, where we are targeting wave C of the flat to mature at a minimum of 1.3218 and complete wave Y. In the case of a regular flat, it could slide further toward 1.3026.
A combination consists of two or more corrective waves, and their occurrence is simply to extend a sideways action.
When drilling down on wave C of wave Y in a shorter time frame, it appears that the first wave (i) of a five-wave impulsive pattern (i)(ii)(iii)(iv)(v) is about to reach maturity around 1.3445. Following this impulsive move, we might expect a corrective pattern, labelled as wave (ii), which, according to Elliott Wave guidelines, should retrace to a minimum of wave (iv) of a lesser degree, around 1.3738. It should be noted that a corrective pattern can have various retracement levels, so we should wait for the pattern to unfold before providing further insights into the appropriate retracement level. After the completion of pullback wave (ii), the trend is expected to continue downward toward the target level to complete the 5-wave impulsive pattern of wave C of the flat.
However, a break above 1.3945 would invalidate the entire structure.
Technical Analysis
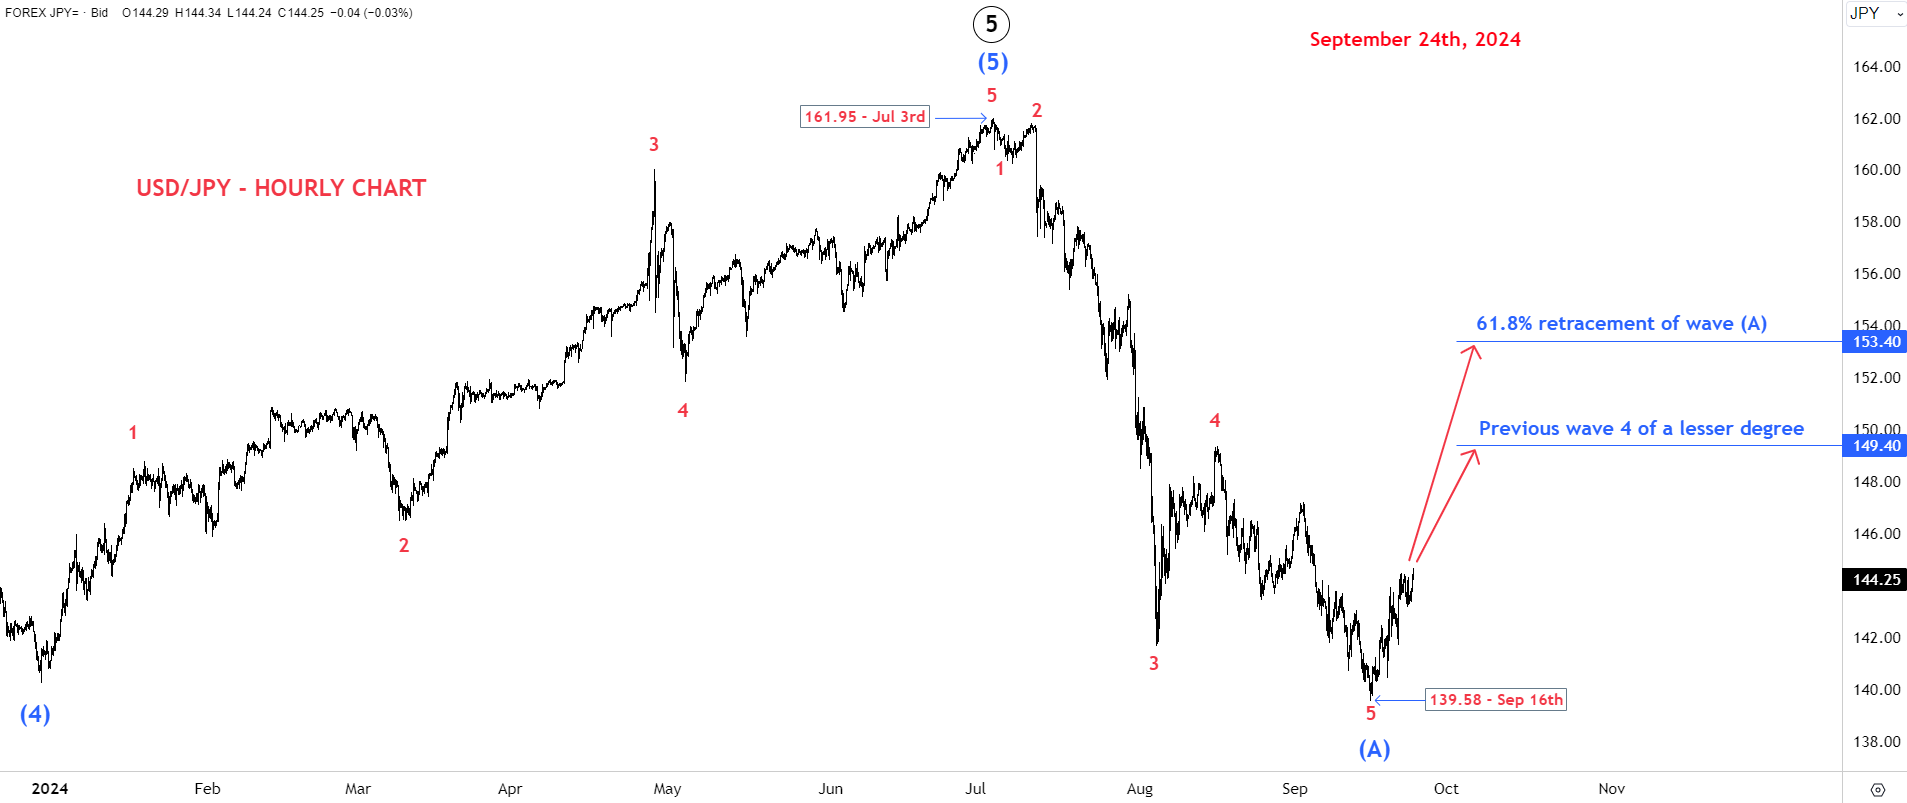
Wave (A) has stopped at the end of the previous wave 4 of one lesser degree, labeled wave (4), and has achieved a 61.8% retracement of the previous wave of one higher degree, wave ((5)), which indicates that the pair will now be moving in the opposite direction.
A primary target for the USD/JPY pair is the end of the previous wave 4 of a lesser degree, labeled wave 4 – within wave (A), which stands at 149.40. An alternative target for the pair would be a 61.8% retracement of wave (A), which would take USD/JPY to 153.40.
In Elliot Wave terms, an impulsive wave ((5)) has completed and it is expected to be followed by a corrective wave. We postulate the impulsive decline to the previous wave 4 of one lesser degree to be the wave A of a potential zigzag. We thus postulate the current move up to be the wave B of the potential zigzag.
On the other hand, if the pair declines further from its current level of 144.25 and passes below the 139.58 level, it could indicate that wave 5 of wave (A) has not yet completed, and that wave (A) may extend its retracement of wave ((5)) to 137.40 or 134.65, which are the 70.7% and the 78.6% retracement levels of wave ((5)) respectively.