The best way to predict the future is to create it.
against MUR
USD
EURUSD
The Euro remained stable around $1.0850 ahead of the Minutes from the Federal Open Market Committee meeting which was held on May 1st.
GBPUSD
The Pound Sterling stayed range-bound around $1.2710 ahead of a flurry of inflation data prints, including consumer and producer price indexes and the Retail Price Index to be released today.
USDJPY
The Japanese Yen traded on the back foot around 156.30 against the greenback as both imports and exports from Japan rose by less than was expected.
AUDUSD
The Australian dollar regained the $0.6660 level, inspired by the New Zealand dollar rally following the hawkish RBNZ hold decision.
USDCAD
The Canadian dollar receded yesterday against its U.S. counterpart after domestic inflation cooled, increasing bets of a rate cut from the Bank of Canada in June. The pair was trading at 1.3643 in the early Asian session.
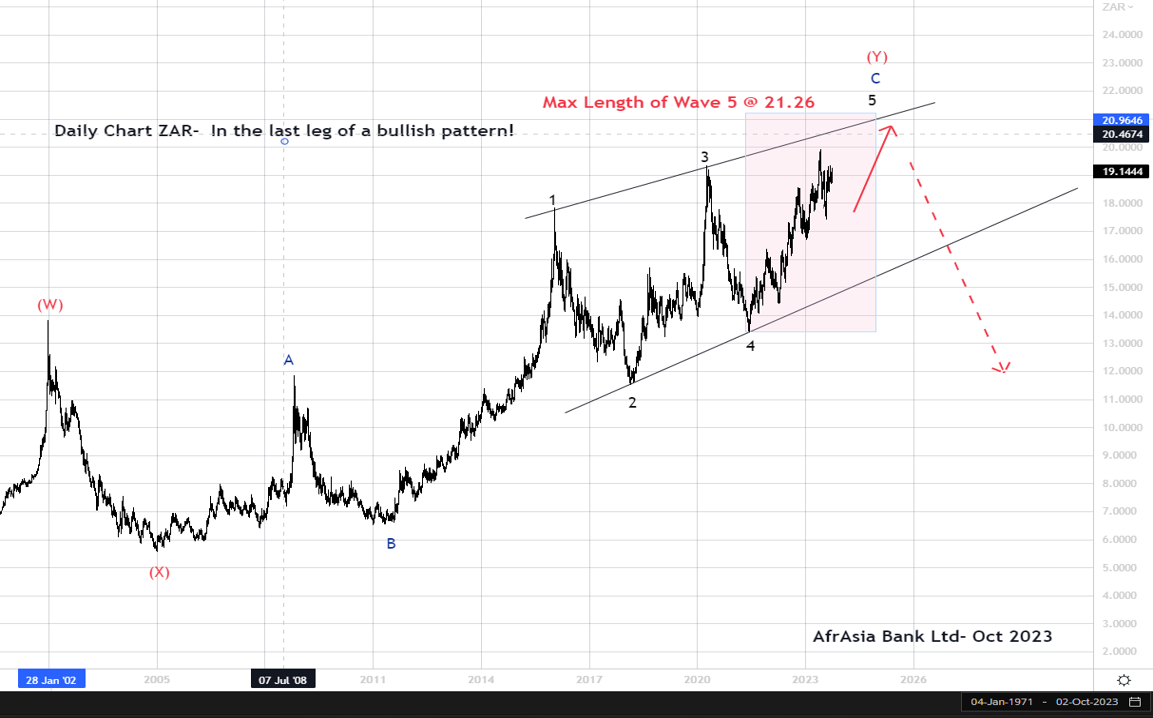
USDZAR
South Africa's rand strengthened to a 10-month high of 18.02 against the U.S. dollar on Tuesday, a week before the general election, with analysts citing rising expectations that the outcome of the election was unlikely to disrupt markets. The pair is currently trading at 18.08.
USDMUR
The dollar-rupee inched up 2 cents to 46.40(selling) this morning.
12:00 EUR ECB President Lagarde speech
14:00 EUR German Buba Monthly Report
16:40 USD Fed's Goolsbee speech
16:45 GBP BoE's Breeden speech
18:00 USD Existing Home Sales Change
22:00 NZD RBNZ's Governor Orr speech
22:00 USD FOMC Minutes

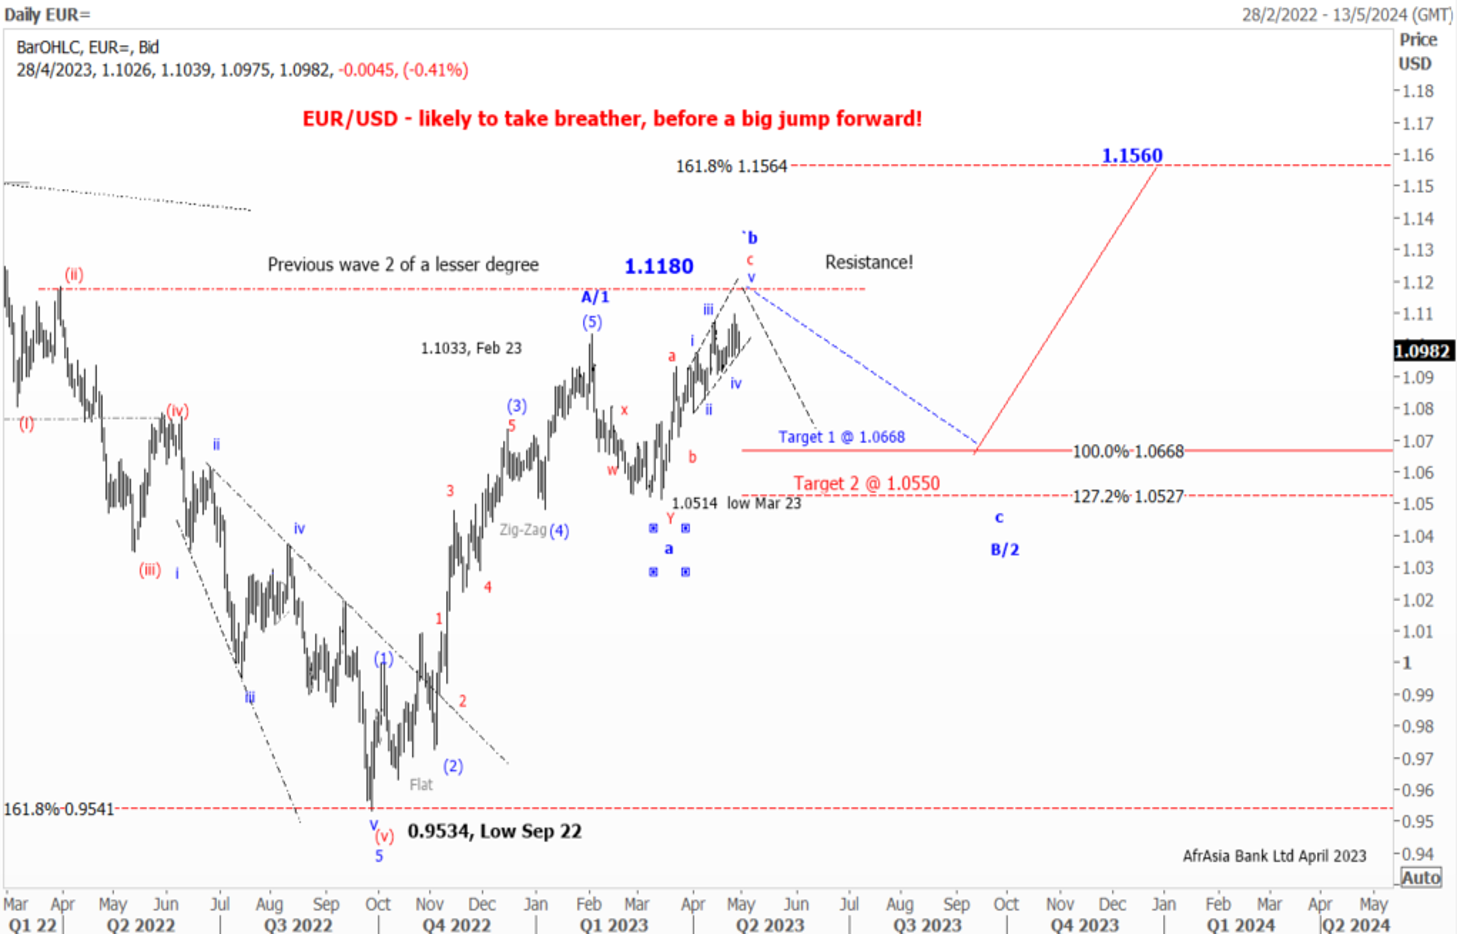
As expected, the EUR/USD has been on a steep uptrend since September 2022 on hawkish ECB.
Elliott wave pattern
Daily Chart
A Clear impulsive 5-wave structure from a low of $0.9534 to a high of $ 1.1035 in February 2023
Possible Expanding Diagonal in wave c of wave b of a flat correction
Forecast
Short term
We expect a corrective setback in wave C in the coming month
1st target 1.1.0670 Wave a =Wave C of a flat correction
2nd Target 1.0530- Wave a =127.2% of wave C of a flat correction
Long term
Once the pullback is completed, we might see the EUR/USD jumping out of the block to $1.1560, followed by $1.2000 by year-end of 2023
News
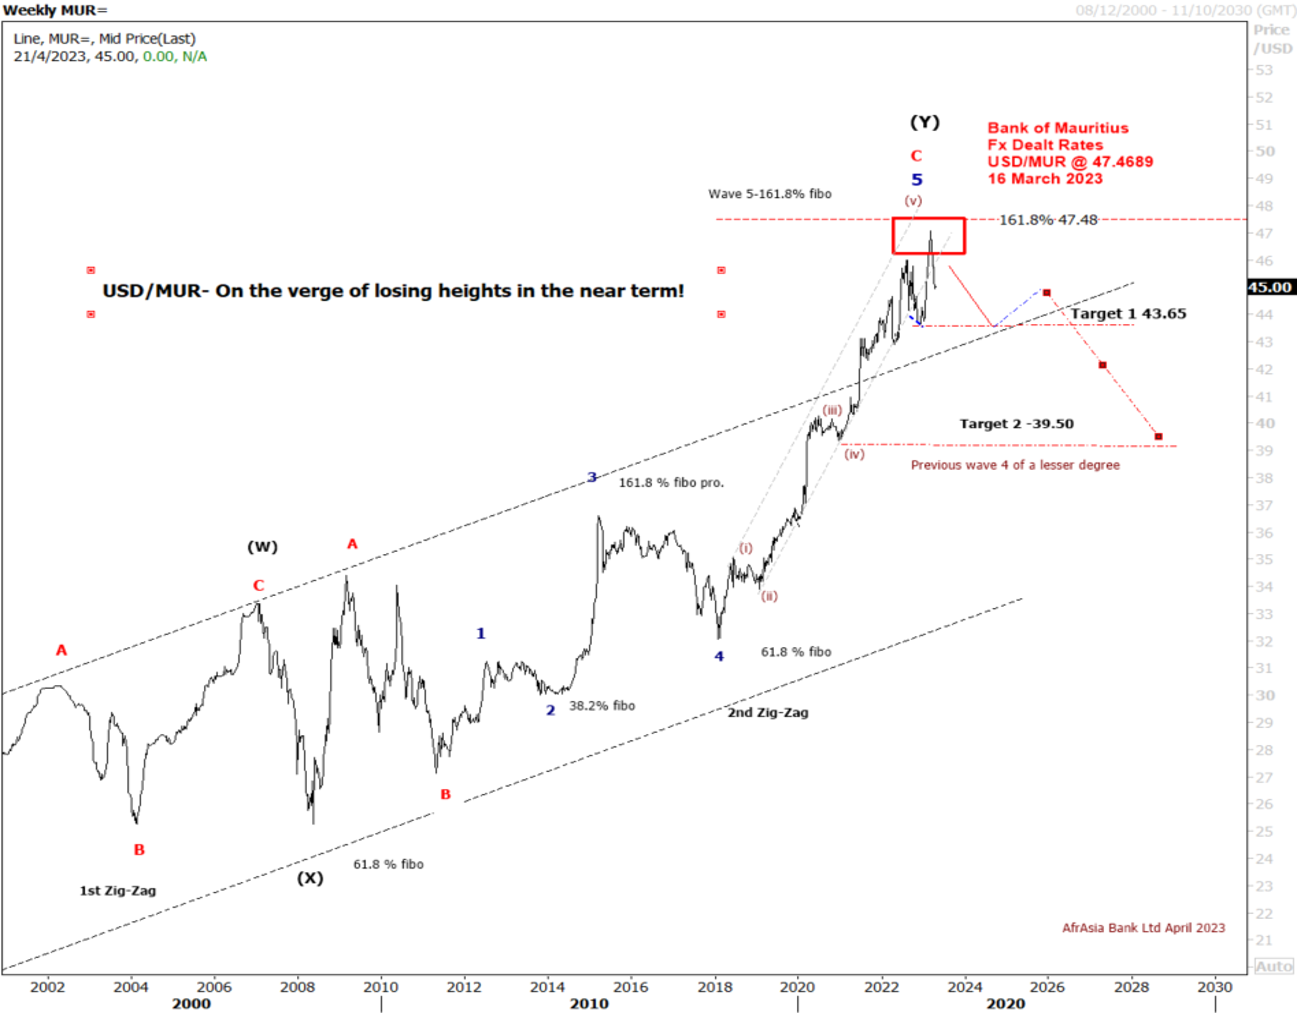
The USD/MUR suddenly burst to a new high at 47.48 in March, driven by FX liquidity concerns, before BOM stepped in to smooth the excessive volatility and injected USD 30 mio on the domestic market.
The USD/MUR fell sharply to 45.40 in the wake of three interventions of the Bank of Mauritius from March 2023 to date.
Elliott wave pattern- Weekly Chart
Double zig-zag upward correction in wave W-X-Y, since 2000 completed!
Bearish turn ahead!
Clear 5-wave structure in wave 5 of wave C of wave (Y)
Over the last four years, the USD/MUR surged by 42% from a low of 32.90 in wave 4 to reach an all-time high of 47.47 on 16th of March 2023, before falling back to 45.40 in an impulsive decline from Mid-March to late April 2023
Forecast- USD/MUR on the brink of a downturn in Q2-Q4 of 2023
On the weekly USD/MUR chart, It seems that the pair may have completed a five-wave upward rally in sub-wave (v) of Wave 5 of Wave C of Wave Y with a peak of 47.47 on the 16th of March
Our Short term target is for a downward trend towards 44.00 followed by 43.00 in December 2023
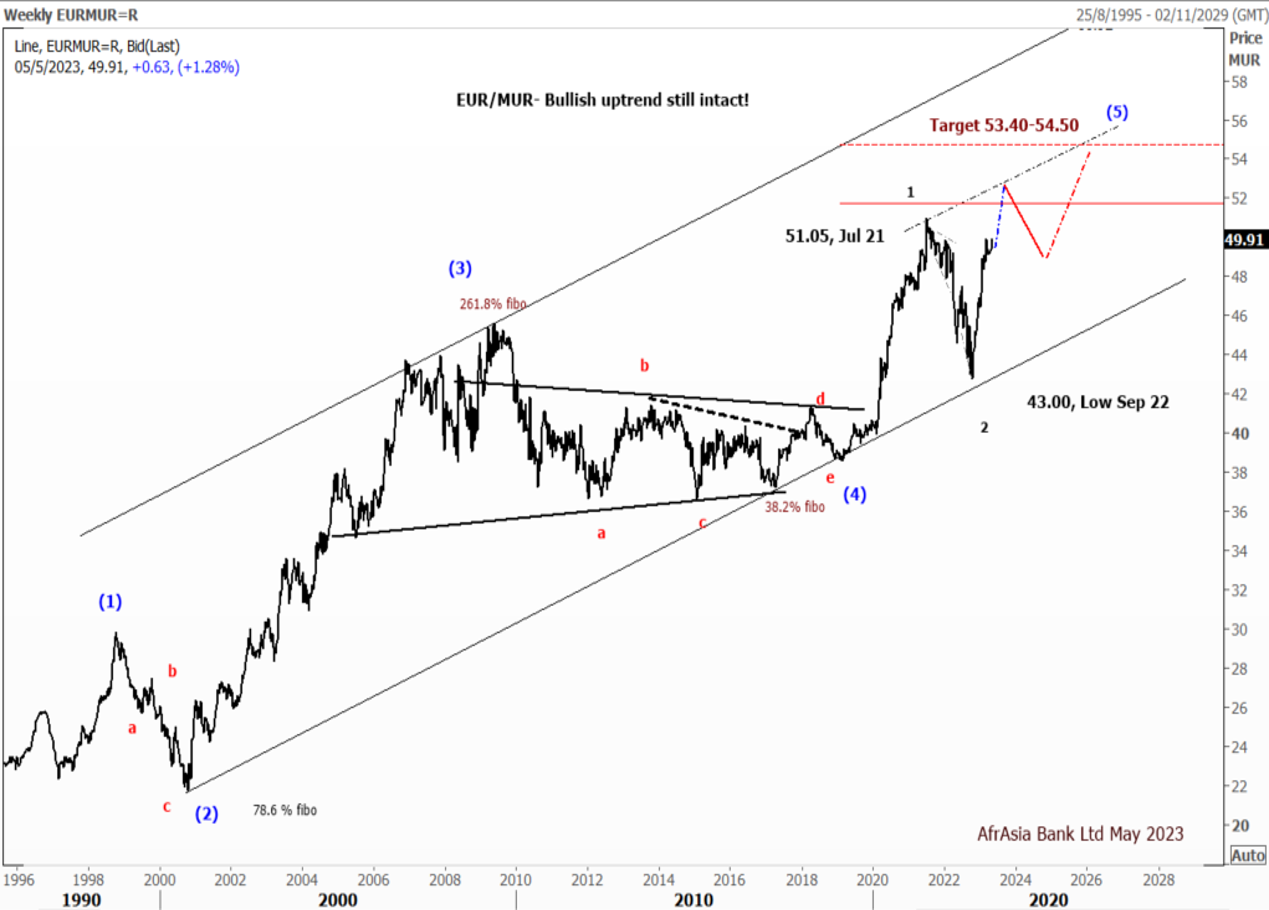
Forecast
EUR/MUR- On the weekly chart, the EUR/MUR may extend its rally in the short term above the high of 51.05 printed in July 2021.
From a technical perspective, on a break of the previous high at 51.05, the pair may find resistance at 52.00, followed by 52.50 by June 2023.
However, we expected the pair to pare some of its gains to 48.50 by September 2023 before a resumption of the uptrend to 53.40-54.50 by December 2023
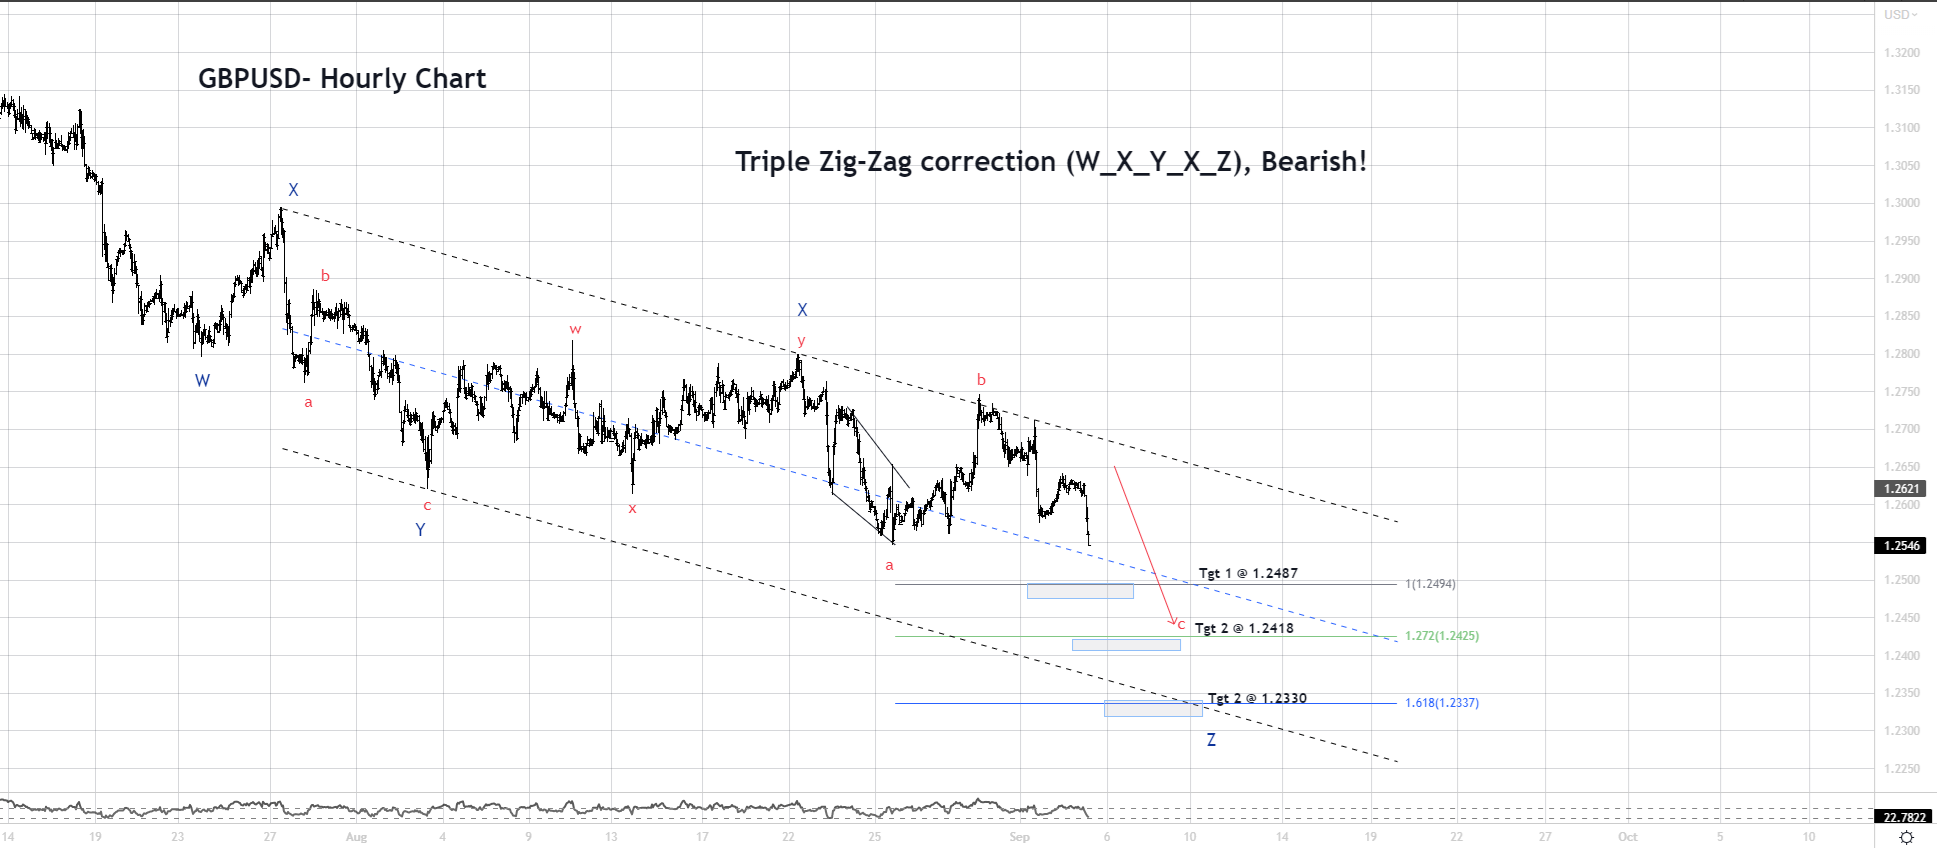
The Pound Sterling is experiencing a lot of selling pressure against the U.S. dollar due to the ongoing risk aversion theme. The Bank of England's aggressive monetary policy tightening is also causing concern for the U.K. economy, as it may not pause the policy tightening spell in time.
Additionally, Britain's Consumer Price Index (CPI) is currently the highest among G7 economies, which may require more rate hikes in the future. However, UK Finance Minister Jeremy Hunt has reassured the public that the administration is working to bring inflation down to almost 5% by year-end.
From a technical standpoint, the GBP/USD is still trapped in a Triple Zig-Zag Correction on the Hourly Chart. This could potentially lead to the pound reaching new lows in the coming sessions/days.
The downside targets are as follows:
- Target 1 @ 1.2487
- Target 2 @1.2418
- Target 3 @ 1,2330
On the flip side, if the pound were to move back to $1.2641 and 1.2710, it would invalidate the bearish count!
News
The Rand has experienced a 10.3% decrease against the U.S. dollar in Q3 of 2023. This is due to a less optimistic economic outlook, which has been impacted by the Eskom power supply issues in South Africa.
Technical Outlook
A Diagonal pattern in wave C of wave (Y) is still underway.
Looking at the Elliott wave pattern, the USD/ZAR Daily Chart reveals a Diagonal pattern in wave C of wave (Y) is still in progress. The overall pattern from January 2011 to October 2023 appears to be forming a Clear 5-wave motive
structure (Diagonal) in wave C of wave (Y).
Forecast
We anticipate the USD/ZAR to gradually increase to a maximum of 21.26 in the upcoming months before reversing in the first quarter of 2024.
1st target 19.92- high of May 2023
2nd Target 20.65- upper trendline connecting wave 1-3
3rd Target 21.26- Maximum length of Wave 5 of wave C